ft. ARC Prize Foundation

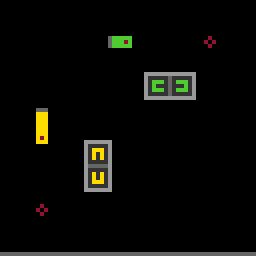
Astra scored 99.9% on ARC-AGI-3. What did it actually do? This benchmark, built by ARC Prize Foundation, asks a model to enter unfamiliar games, discover their rules, and learn to finish efficiently. Before unpacking the number, try one of its public environments.

Try SK48 yourself first

Use the arrows. Discovering the goal is part of the task.

SK48Level — / 8
Starting the official ARC-AGI-3 game…
Click screen
Undo
Reset run
Help
Continue reading: what did that measure? →

How GPT-6 Astra solved ARC-AGI-3 game s5i5

The game above gave you pixels, colors, and a mouse. A model gets none of those. In ARC Prize’s open-source benchmarking harness, every turn arrives as plain text: the game’s state, the number of levels completed, the screen written out as a 64 by 64 grid of integers from 0 to 15, and a list of legal actions. The whole instruction is one short system message: [S73]

You are playing a game. Your goal is to win. Include any context you want to carry forward in your reply, along with the action you want to take. The final action mentioned in your reply will be executed next turn.

On 31 August 2026, ARC Prize recorded GPT-6 Astra at max reasoning effort clearing all eight of its levels in 242 moves over about ninety minutes, and linked the replay from its report. Every move came with a short note Astra wrote alongside its click, reproduced below exactly as recorded. [S72] [S56]

Astra guesses the rules on move 1, then tests one button

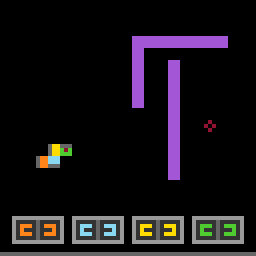
The first screen shows two bars, each with a dark dot at one end, two small red crosses, and two gray boxes of buttons. There are no labels and no stated goal. Astra’s first note is already a theory: each dot should reach a cross, and each gray box drives one bar. It tests the theory by clicking one button.

Astra calls these bars “orange” and “blue”. It never saw a color, only the numbers 14 and 11, and its names do not match how the game draws them for people. By level two it drops the color words and refers to parts by number.

  1. Dot on bar 14
  2. Cross
  3. Button clicked
  4. Dot on bar 11
  5. Cross
  6. Second button pair

One click shows that each press grows the bar 3 cells

The test click grew the bar three cells to the right and changed nothing else. Astra turns that into arithmetic: the dot sits at 34, the cross at 52, so six more clicks. The rest of the level is counting clicks. Reasoning tokens fall from 867 on move one to 203 on move two, and to 71 by move twelve.

  1. +3 cells per click
  2. 6 clicks away

Level 2: Astra plans all 26 clicks before making the first

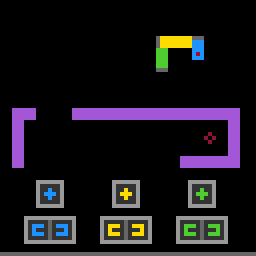
Level two puts a purple wall between a jointed four-segment arm and the cross it has to reach, with one button pair per segment along the bottom. Astra spends 1,863 reasoning tokens on the first move, almost five times this run’s median move, and writes out the whole solution: extend segment 12 eight times, 10 eight times, 11 four times, 14 six times. It carries out all twenty-six clicks without revising the plan. The median person who finished this level used 89 moves.

  1. Cross
  2. Wall
  3. Four-segment arm
  4. 12
  5. 10
  6. 11
  7. 14

Astra’s note becomes a vector it updates after every click

One move into level two, the note has turned into a data structure. “(12,10,11,14) = (1,0,0,0)” counts how far each segment has been extended, and “(8,8,4,6)” is the target. Astra rewrites the first vector every turn, so the note alone says exactly where it is in the plan. ARC Prize singled out this behavior in its report: unfamiliar scenes turned into compact, code-like symbolic models.

  1. 1 of 8
  2. 0 of 8
  3. 0 of 4
  4. 0 of 6

Level 3: 4,762 tokens of thinking, then 37 moves where people took 106

Level three has six arms, each with a retract button and an extend button, and some arms have to move out of the way before others can pass. Astra spends 4,762 reasoning tokens before the first click, its most on any single move in the game, and solves the ordering in advance: 12→3, 9→3, 14→4, 12→0, 8→1, then 10→12 and 7→8. Arm 12 goes out to three and later back to zero to make room for a later move. The level takes 37 moves; the median person who finished it took 106.

  1. 8
  2. 10
  3. 12: retract clicked
  4. 9
  5. 7
  6. 14

Level 4: one test click reveals that five rods move together

Level four scatters five yellow rods across the screen and gives them a single button pair in the same color, which Astra knows only as the number 11. On the move before this one, Astra wrote “Testing linked 11 rods.” and clicked once. The result it recorded: “All five 11 rods extend together.” No still frame shows that link; Astra found it only by clicking.

  1. Rod 11
  2. Rod 11
  3. Rod 11
  4. Rod 11
  5. Rod 11
  6. One button moves all five

Level 5: Astra tests which arm moves the pillar, then re-plans around a blocker

Level five has four arms, one pillar, and no sign of which arm moves what. On move 107 Astra wrote the question into its note, “Testing whether retracting 9 moves the blue pillar at x30–32”, and clicked. On move 108 it recorded the answer: the pillar moved right to x33–35 and is now blocked at x36–38. It then queued nine more steps to lift the pillar over the block, spending 4,142 reasoning tokens on the question and 3,106 on the new plan.

  1. Pillar, now x33–35
  2. Blocker, x36–38
  3. Clicked: 12 extend

Level 6: Astra guesses what a new button does and records the answer as a rule

Level six adds square buttons with a plus sign above the length controls, and nothing says what they do. On move 135 Astra guessed, “Upper buttons likely rotate”, and clicked one. On move 136 it wrote the result as a general rule rather than a note about one click: “rotating a joint turns it and its children 90° counterclockwise.” With that rule, it plans the rest of the route through the gap in the wall.

  1. Rotate 9?
  2. Rotate 11?
  3. Rotate 14
  4. Gap x9–17
  5. Cross
  6. Jointed arm

Level 7: a click does nothing, and Astra learns segment 9 cannot go below 1

Level seven was the hardest for Astra: 47 moves and 36% of all the reasoning tokens it spent on the game. Its plan called for retracting segment 9 to zero, and the click changed nothing. Its note says “Retracting 9 again made no change”, and a few moves later it adds a new rule: “Minimum length9=1”. Astra routes around the limit by rotating segment 9 instead, and notes that rotating 9 also rotates 12.

  1. Segment 9, stuck at 1
  2. Retract did nothing
  3. Rotate 9
  4. Cross

Level 8: the shorthand note ARC Prize quoted in its report

Level eight puts four arms on a hub that rotates them together, with two gates across the main arm’s path to the cross. Astra’s note is laid out like a small program: a line of current state, then a nine-step plan with three rotations of the hub along the way. ARC Prize quoted this note in its report as an example of Astra’s on-the-fly algebraic shorthand. “q2” is Astra’s own name for the hub’s second rotation; nothing in the game calls it that.

  1. Hub (q2, 8↓)
  2. Rotate hub
  3. Gate 7
  4. Gate 10
  5. Main arm 14
  6. Cross

Move 242: Astra clears all 8 levels with no resets

The last click puts the tip of arm 14 on the cross, and the game reports WIN. Astra cleared eight levels in 242 moves with zero resets. The human baselines for the same eight levels, each the median move count of the people who finished that level, add up to 638.

  1. Tip of arm 14
  2. Cross
  3. Final click

Astra thinks hardest on the first move of each level, then barely thinks while executing

The strip of bars under the screen shows the reasoning tokens for each move, filling in as you scroll through the run. The median move in this run used 392 reasoning tokens. The first move of a new level routinely used thousands: 1,863 at the start of level two, 4,762 at the start of level three, 4,142 at the start of level five. Then the bars drop, often below 200, while Astra carries out the plan it already made. ARC Prize reports that frontier models generally play within human efficiency once they have worked out a game’s mechanics. Level seven is the exception: Astra’s predictions kept failing, and its token use stayed high. That single level used 67,435 reasoning tokens, 36% of the game’s total of 186,683. [S72] [S56]

Given a code sandbox, Astra wrote its own Python tools

In the s5i5 run, the only thing Astra produced besides its moves is its notation. ARC Prize also ran Astra in PRO-LONG, a harness with a code sandbox, where it wrote software. On tu93, a maze game with guards and moving patrols, Astra started with navigation and wrote maze_solver.py, added the fighting rules in combat_solver.py, modeled the patrols in patrol_solver.py, and used sync_state.py to check its predictions against what the game actually showed. ARC Prize’s human testers had no code interpreter or scratch pad, so a PRO-LONG result measures the model and its tools together, not the model alone. [S56]

Astra used fewer moves than the median person on all 8 levels

Move count is the part ARC-AGI-3 actually scores. On every one of the eight levels, Astra used fewer moves than the median person who finished it: 242 moves in total, against human baselines that add up to 638. ARC Prize reports the same pattern across the whole evaluation, with fewer actions than the human baseline on 96.0% of levels. [S72] [S56]

AstraMedian person who finished the level
Level 113 vs 20
Level 226 vs 89
Level 337 vs 106
Level 430 vs 54
Level 528 vs 162
Level 625 vs 38
Level 747 vs 86
Level 836 vs 83
242 moves in total, against 638

GPT-6 Astra on ARC-AGI-3 game s5i5, configuration openai-gpt-6-astra-max, recorded 31 August 2026 between 10:00 and 11:30 UTC. Frames, clicks, notes, and token counts are unedited from ARC Prize’s public recording; the tutorial text and callouts are editorial. Human medians are ARC Prize’s per-level baselines for this game. [S72] [S56]

What a benchmark is

A benchmark is a repeatable measurement system. It defines what a model must do, the conditions under which it acts, what counts as success, and how many task-level outcomes become a published score.

In the game, each move shows what one action changes. You watch the result, update your idea of the rules, and try again. Even a failed attempt teaches you something about how the game works.

ARC-AGI-3 measures completion and action efficiency relative to a human baseline. It asks how much interaction a system needs to learn and solve unfamiliar environments. 99.9% is Astra’s aggregate score across the hidden evaluation games. [S56]

A benchmark is more than its questions. Its authors also choose the tasks, decide which answers stay hidden, set the tools and number of attempts, and specify how individual outcomes become one number. A score answers a particular question: under these conditions, how did this system perform on this test?

ARC began in 2019 with François Chollet’s grid puzzles: study a few examples, infer the rule, and apply it to a new input. ARC-AGI-2 arrived in 2025 with new puzzles that demanded more complex combinations of rules. ARC-AGI-3 changes the format: instead of studying completed examples, you act inside a game and learn from what happens. All three test how well a system learns an unfamiliar task from limited experience. [S59] [S07] [S60]

Where the idea came from

In the 1960s, a US government reviewer named J. R. Pierce looked at the field of machine translation and concluded that its claims could not be checked. American funding for it collapsed for twenty years. [S40]

It came back in the 1980s when a team at IBM started training translation systems on the bilingual transcripts of the Canadian parliament, and measuring the results against a held-back set of transcripts nobody could see in advance. By the late 1980s the US defence research agency had made this the condition of funding, and hired the National Institute of Standards and Technology to hold the secret test data and do the scoring. [S40]

That arrangement is called the Common Task Framework. It has three parts: shared training data, competitors working on the same problem, and a referee scoring against data kept behind a wall. It produced text retrieval benchmarks in 1992, ImageNet in 2009—whose 2012 competition result set off the deep learning boom—and, eventually, the benchmarks on this page. [S40] [S43] [S44] [S45]

How ARC Prize built ARC-AGI-3

ARC Prize’s own game studio designed every ARC-AGI-3 game, tested each one with people, and kept most of them hidden.

  1. ARC-AGI-3 tests whether a player can learn an unfamiliar world

    The player has to explore an unfamiliar game, work out its rules, find the goal, and plan a way to reach it. Because ARC-AGI-3 is played move by move, every step of that learning is recorded. [S64]

    An ARC-AGI-3 game gives no text, no goal and no instructions
    SK48’s real opening frame, the same game at the top of this page.
  2. ARC built every game in an in-house studio, with novelty required

    ARC built an in-house game studio. Developers proposed concepts for review, built prototypes, and tested them internally before external playtesting. Novelty was a design requirement. [S61]

    Every game passes four production stages before it is used
  3. Later levels combine mechanics from earlier ones

    Early levels introduce interactions. Later ones combine mechanics learned along the way, so progression tests whether the player can use what they discovered. [S61]

    In s5i5, each level adds a new mechanic to the earlier ones
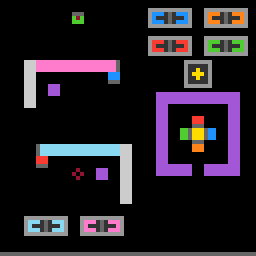
    Opening screens of four levels from ARC Prize’s public s5i5 recording. [S72]
  4. Automated checks catch crashes, broken states and accidental solutions

    Automated checks look for crashes, malformed states, and accidental solutions. Replaying known action sequences checks that the environment behaves reproducibly. [S61]

    Four automated checks run before any person plays a game
    Source: ARC’s technical report.
  5. 458 people played, and every game kept was solved by at least two

    The human study involved 458 participants. Every retained environment was completed by at least two people. So every kept game is solvable by people, though not every person solved every game. [S63]

    10 people try every game, and at least 2 must finish it
    The two highlighted seats illustrate the minimum; many games were finished by six or more people.
  6. The human baseline is the upper-median action count of people who finished

    For each level, rank completing players by actions taken and use the upper median. With four or five finishers, that is the third entry. The reference comes from first-time play. [S62]

    With 5 finishers, the 3rd-lowest action count becomes the baseline
    Illustrative.
  7. Most games stay hidden: 25 public, 55 semi-private, 55 private

    The April report describes 25 public, 55 semi-private, and 55 fully private games. The hidden sets use a wider range of mechanics. The public games show the format; they are not the official evaluation. [S61]

    25 public games, 55 semi-private, 55 private
    Counts from ARC’s April 2026 technical report.

How ARC-AGI-3 turns moves into a score

ARC-AGI-3 scores each level by comparing the player’s action count with a human baseline, then combines levels into a game score and games into one benchmark score.

ARC-AGI-3 counts every action, including exploration

In the game at the top of this page, as in every ARC-AGI-3 game, ARC counts the actions taken to complete each level, including exploration. Internal reasoning is not counted as an environment action. [S62]

This level took 40 actions, including every exploratory one
Illustrative.

Each level is compared with its human baseline: 40 moves against 20

Each level has its own human baseline. In this illustrative example the baseline is 20 actions and the agent needed 40, twice as many. [S62]

The agent took 40 actions where the human baseline is 20
Illustrative.

A level scores (human moves ÷ agent moves)², so 20 against 40 scores 25%

For a completed level, divide human actions by agent actions, then square the ratio. Here, (20 ÷ 40)² = 25%. An unfinished level scores zero. [S62]

(20 ÷ 40)² gives this level 25%

Beating the human baseline is capped at 115% per level

A completed level can earn up to 115%. Beating the human baseline earns extra credit, but only up to that cap, so one very efficient level cannot outweigh the rest. [S62]

Astra’s 26 actions against a baseline of 89 would score 1,172%, capped at 115%
Real counts from ARC Prize’s public s5i5 recording. [S72]

Level 1 counts once and level 8 counts eight times

Level 1 has weight 1, level 2 weight 2, and so on. Scores are averaged with those weights. A completion cap stops efficient early levels from making up for unfinished ones. [S62]

Finish seven of eight levels and the game score can reach at most 28 ÷ 36 = 77.8%.

Weights run 1 to 8, so 7 of 8 levels caps the game at 77.8%
Illustrative. The outlined level is unfinished.

The final score averages every game, between 0% and 100%

Average the game scores across the evaluation set. Every game counts, and the total stays between 0% and 100%. [S62]

Three games scoring 100%, 77.8% and 25% average to 67.6%
Illustrative. The average uses 28 ÷ 36 before rounding.

Astra scored 99.9% or 54.8% depending on the harness

At high reasoning, Astra scored 99.9% with Provider Adapter and 54.8% with Standard. The harness is the software that runs the test, and it controls what carries from one action to the next. Standard makes the model keep visible notes; Provider Adapter keeps its private reasoning between turns and compacts long conversations. These are separate configured runs. ARC Prize reported Astra’s best semi-private score on Standard as 62.7%, from another run at max reasoning. [S56]

Astra: 99.9% on Provider Adapter, 54.8% on Standard
Published 3 September 2026. Same model and reasoning setting, run separately. [S56]
See the complete scoring rule

Level: unfinished = 0; otherwise min(1.15, (human actions ÷ agent actions)²).

Game: weight each level by its number. Divide the weighted score sum by all level weights. Cap the result at completed level weights ÷ all level weights.

Benchmark: average the game scores across the evaluation set.

The human baseline uses the upper median of completing first-time players, separately for each level. [S62]

Read any benchmark score by asking four things: Which test? Which system? Under what rules? Based on how much evidence?

How to read a model release

A model release lists many scores in one table.

Each row of a release table is a different test

A release table puts many different experiments in one grid. A column names the model; a row names a particular test. For each row, check what the model had to do and what counted as success.

These selected results come from OpenAI’s official GPT-6 Astra release, checked on 17 September 2026. [S65]

Each row in Astra’s release table is a different test
READ THE RELEASE01 / 06
OFFICIAL RELEASE, SELECTED ROWSAstraSolFable 5.1ARC-AGI-399.9%7.8%—DeepSWE v1.174.1%72.7%67.4%GeneBench Pro37.1%32.3%—SRE-Bench, 4 tries99.2%68.7%—Auto-review (lower ↓)0%0.29%—A percentage sign is not a shared unit.
Selected results from OpenAI’s official release. SRE-Bench shows the four-attempt result reported in the release text.

The same % can mean success rate, efficiency, or an unwanted behavior

The same “%” can stand for different things. ARC-AGI-3 combines completion with action efficiency. SRE-Bench reports task success. A circumvention rate measures an unwanted behavior, so lower is better. [S62] [S65]

Read the scoring rule before comparing numbers. A higher percentage in one row does not make that task easier, or that capability stronger, than another.

ARC-AGI-3, SRE-Bench and Auto-review each use % differently
READ THE RELEASE02 / 06
WHAT DOES THE PERCENTAGE COUNT?99.9%ARC-AGI-3Completion + action efficiency99.2%SRE-BenchTasks solved within four attempts0%Auto-review circumventionObserved rate (lower is better)
Results from the official release; meanings checked against the benchmark documentation.

Reasoning effort, tools and harness change the score, so read the footnotes

Reasoning effort, tools, prompts, time limits, and the harness can change what a model achieves. The footnotes record those settings. OpenAI’s ARC-AGI-3 note identifies a particular harness; ARC Prize reports separate results for different harnesses and reasoning settings. [S65] [S56]

Before comparing two columns, check whether they used comparable conditions. If the setup differs, you are comparing two systems as tested—not isolating the model alone.

Reasoning effort, tools and harness sit beside every score
READ THE RELEASE03 / 06
THE UNIT UNDER TEST IS A CONFIGURED RUNMODELEFFORTHow much reasoning?TOOLSWhat can it use?HARNESSHow does it act?MODEL + CONDITIONS → RESULT
Schematic configuration diagram. Follow a table’s footnote to the settings of the actual run.

Astra scores 88.0% on one attempt and 99.2% within four

OpenAI reports 88.0% for Astra on SRE-Bench with one attempt and 99.2% within four. The first number measures first-try reliability; the second measures whether it gets there at all. [S65]

“Can it succeed at least once?” is different from “Will it work on the first try?” Keep attempts, time, and cost attached to the comparison.

SRE-Bench: 88.0% on one attempt, 99.2% within four
READ THE RELEASE04 / 06
SRE-BENCH, ASTRA, REPORTED RESULTSOne attempt88.0%Up to four attempts99.2%+11.2 percentage pointsMore chances change the measured success rate.
Reported endpoints, not a simulation. Outcomes for attempts two and three are not interpolated.

A dash means no score was reported, not a score of zero

A dash tells you that the table has no score in that cell. It does not tell you that the model failed every task—or, by itself, why the result is missing. Look for the accompanying explanation.

An “internal” label identifies an evaluation’s provenance. Check what task descriptions, grading rules, and results are available to inspect. Less public detail means less you can check yourself. [S65]

A dash marks a missing score, not a zero
READ THE RELEASE05 / 06
READ THE SYMBOLS AS CAREFULLY AS THE SCORES—Missing entryNo score shown in this table0%Reported zeroA measured result under this testinternalWho can inspect it?Follow the methods and evidence
How to read the marks in the release table.

Weigh the benchmarks that resemble your own work

If you are choosing a coding model, begin with coding evidence. Then ask whether the task, tools, success criteria, and resources resemble your own. A test on one kind of programming work is a lead to check against your own codebase.

A benchmark supports a narrow conclusion: this system did better on this kind of task, under these conditions. Try it on representative work before treating that result as a prediction.

Look up a benchmark →

Start from the rows that match your own work
READ THE RELEASE06 / 06
CHOOSE THE ROWS THAT MATCH YOUR DECISION“Will it help with my codebase?”Start with evidence about that kind of work.TASKSimilar work?TOOLSSimilar environment?SUCCESSSimilar standard?BUDGETSimilar resources?
Illustrative.

Read the official GPT-6 Astra release and evaluation footnotes → [S65]

How Epoch combines benchmark results into one index

A release table lists results one by one; Epoch’s index combines them into one estimate.

Epoch’s index puts many benchmark results on one scale

A model has many benchmark results. A single index is a way to summarize that profile and compare models across a wider range of difficulty. Epoch’s Capabilities Index, or ECI, brings results from many tests onto one scale. [S66]

The small table is illustrative. It shows what an index has to handle: different tests, different difficulty, and models that did not take every test.

Three models with results on three tests
EPOCH CAPABILITIES INDEX01 / 06
SCHEMATIC, THREE MODELS, THREE TESTSTEST ATEST BTEST CModel A90%60%30%Model B80%50%—Model C60%30%10%Different tests capture different parts of the picture.
Fictional models and percentages illustrate overlapping coverage. They are not inputs to Astra’s ECI.

Models that take the same tests link those benchmarks onto the scale

When models take overlapping tests, their results help connect the measurements. Epoch fits a statistical model that estimates model capability together with each benchmark’s difficulty and how quickly scores rise. [S67]

So ECI is not a simple average of the percentages in a release table. The diagram shows the idea of a shared scale; it does not reproduce Epoch’s fit.

Shared tests link models onto one scale
EPOCH CAPABILITIES INDEX02 / 06
SHARED TESTS CONNECT THE MEASUREMENTSModel AModel BModel CTest ATest BTest CONE SCALEestimated capability
Schematic connections and positions. No ECI value is calculated from this illustration.

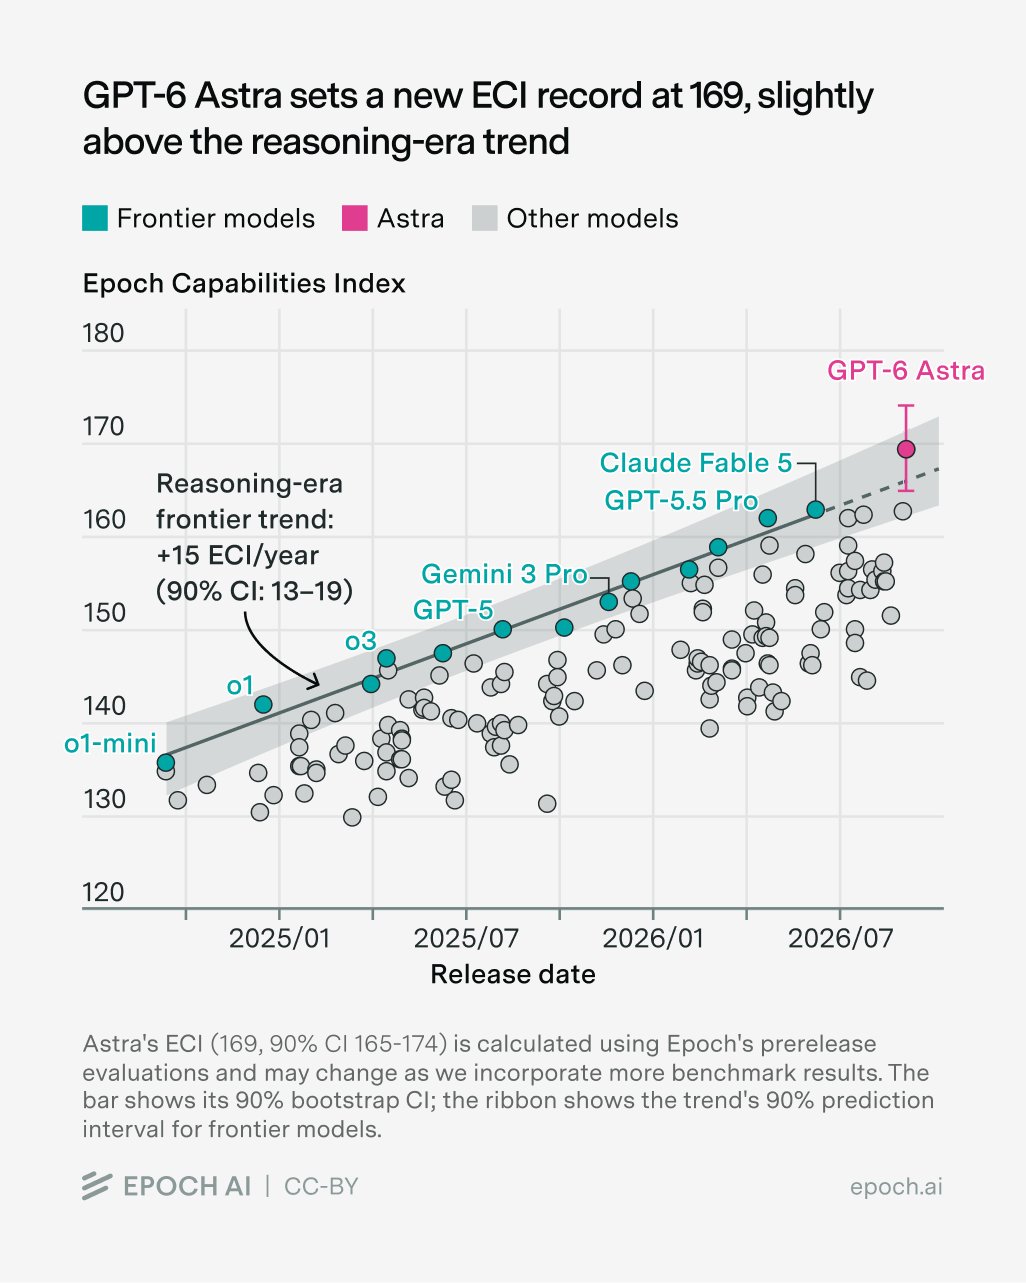
Astra sits at 169 on Epoch’s scale

The launch chart places Astra at 169. That is a point on Epoch’s scale, which has reference points rather than a fixed maximum. [S68] [S70]

A point higher up the chart represents a higher estimated capability on this index. It does not mean the model is better at every individual task.

Astra sits at 169 on Epoch’s index
EPOCH CAPABILITIES INDEX03 / 06
ASTRA, LAUNCH SNAPSHOT169index points
Original Epoch AI chart excerpt, CC BY; editorial overlay. Launch-era estimate, not a live value.

The 169 estimate has a 90% interval of 165 to 174

In this chart, the point estimate is 169 and the reported 90% interval is 165–174. Epoch obtains its intervals by resampling the benchmark evidence and refitting the statistical model. [S67] [S70]

The bar shows uncertainty in the estimate. It is not the range of scores the model gets on different tasks. Two dots a few points apart may not be meaningfully different.

Astra’s 169 has a 90% interval of 165 to 174
EPOCH CAPABILITIES INDEX04 / 06
KEEP THE ESTIMATE AND ITS INTERVAL TOGETHER17416916590%bootstrapintervalThe point alone leaves out uncertainty.
Values from Epoch’s launch chart.

The frontier trend rises about 15 index points a year

The line summarizes the frontier’s change over time. In this historical chart, Epoch reports about 15 ECI points per year. The surrounding ribbon is a 90% prediction interval, a different object from Astra’s own error bar. [S70]

“Above trend” compares a result with that fitted historical pattern. It does not establish a new rate of progress from one model, or guarantee what comes next.

The frontier trend rises about 15 index points a year
EPOCH CAPABILITIES INDEX05 / 06
FRONTIER TREND IN THIS CHART+15 ECI / year
Original Epoch chart with an approximate editorial trace of its trend. The source image retains the actual band.

Use the index for the broad picture and single benchmarks for decisions

An index helps compare broad performance and follow progress. It compresses a profile, so models with similar overall standing can still have different strengths. Epoch also notes that specialization can be obscured by a general score. [S68]

Use the index for the broad picture. Use the individual benchmarks—and the conditions you now know to check—for a particular decision.

Find the task behind a benchmark name →Explore Epoch’s index →

The index summarizes; single benchmarks decide
EPOCH CAPABILITIES INDEX06 / 06
ONE INDEX CAN HIDE DIFFERENT STRENGTHSSAME INDEXModel AMathCodingScienceModel BMathCodingScienceReturn to the tasks behind the summary.
Illustrative.
See the original Epoch chart and dated source notes

Epoch AI’s launch chart reports 169 and explicitly describes the estimate as preliminary. Its model page showed 166 when checked on 16 September 2026. This walkthrough preserves the chart to explain how to read it; it is not a live ranking. ECI estimates can change as the evidence and fitted model change. [S68] [S69]

Epoch AI launch chart: Astra at ECI 169, 90 percent bootstrap interval 165 to 174, frontier trend plus 15 ECI points per year with a 90 percent prediction band.

Chart: Epoch AI, CC BY. [S70]

Find a benchmark: what it tests and how it is scored
A field guide to selected benchmarksCompare what each system tests, where its tasks come from, and how it decides success.
BenchmarkWhat it testsTask sourceGraderFixed / livePublic / protected
Loading benchmark records…

Descriptions summarize the dated records on this page. They do not compare model scores or imply that unlike benchmarks measure the same capability.

Methods, data, and sources

Open the research note, downloadable records, and complete 73-source ledger.

A dated snapshot, not a live leaderboard. Snapshot date: 26 August 2026. ARC-AGI-3 results: 3 September 2026, added 10 September. Methodology checked 16 September 2026. Earlier records keep their own dates.

Every material claim links to a source in the ledger below, favoring official datasets, repositories, methodology pages, evaluator records, audits and research papers. Where a release leaves out model version, prompts, run dates, cost, latency, uncertainty or retry policy, the records mark it missing rather than zero.

The SK48 game runs ARC’s official engine and unmodified game source (sk48-d8078629) on MTS servers. No model or outside game service is called. Your action count is not a benchmark score and isn’t sent to ARC.

73 references, accessed 26 Aug – 24 Sep 2026

Source ledger

Loading source ledger…

Result details